
Older adults in the US have been disproportionately affected by the coronavirus pandemic, comprising the majority of COVID-19 hospitalizations and deaths. Since the authorization of COVID-19 vaccines beginning in December 2020, there has been significant progress vaccinating older adults, who were among the first groups prioritized for vaccines after health care workers and residents and staff in long-term care facilities. As of May 12, the Centers for Disease Control and Prevention (CDC) reported 84.0% of adults 65 and older have gotten at least their first dose and 71.9% have been fully vaccinated.
While there is evidence that vaccinations are already having a major impact on death rates and hospitalization rates for older adults, particularly for the long-term care population, vaccination equity issues still remain a problem and there are challenges reaching certain populations for vaccinations. Rates of fully vaccinated older adults vary across states, from 57.6% in Utah to 87.0% in Vermont (as of May 12, based on national CDC data), but these state-level metrics may mask even greater variation at the county level. County level analysis provides a more granular look at characteristics associated with variations in vaccination rates among older adults across the country.
This analysis examines variations in vaccination rates for older adults by county characteristics, based on data from the CDC as of May 11, 2021 that includes 77% of all counties (2,415) in the US. (See Data and Methods for additional details).
Key Takeaways
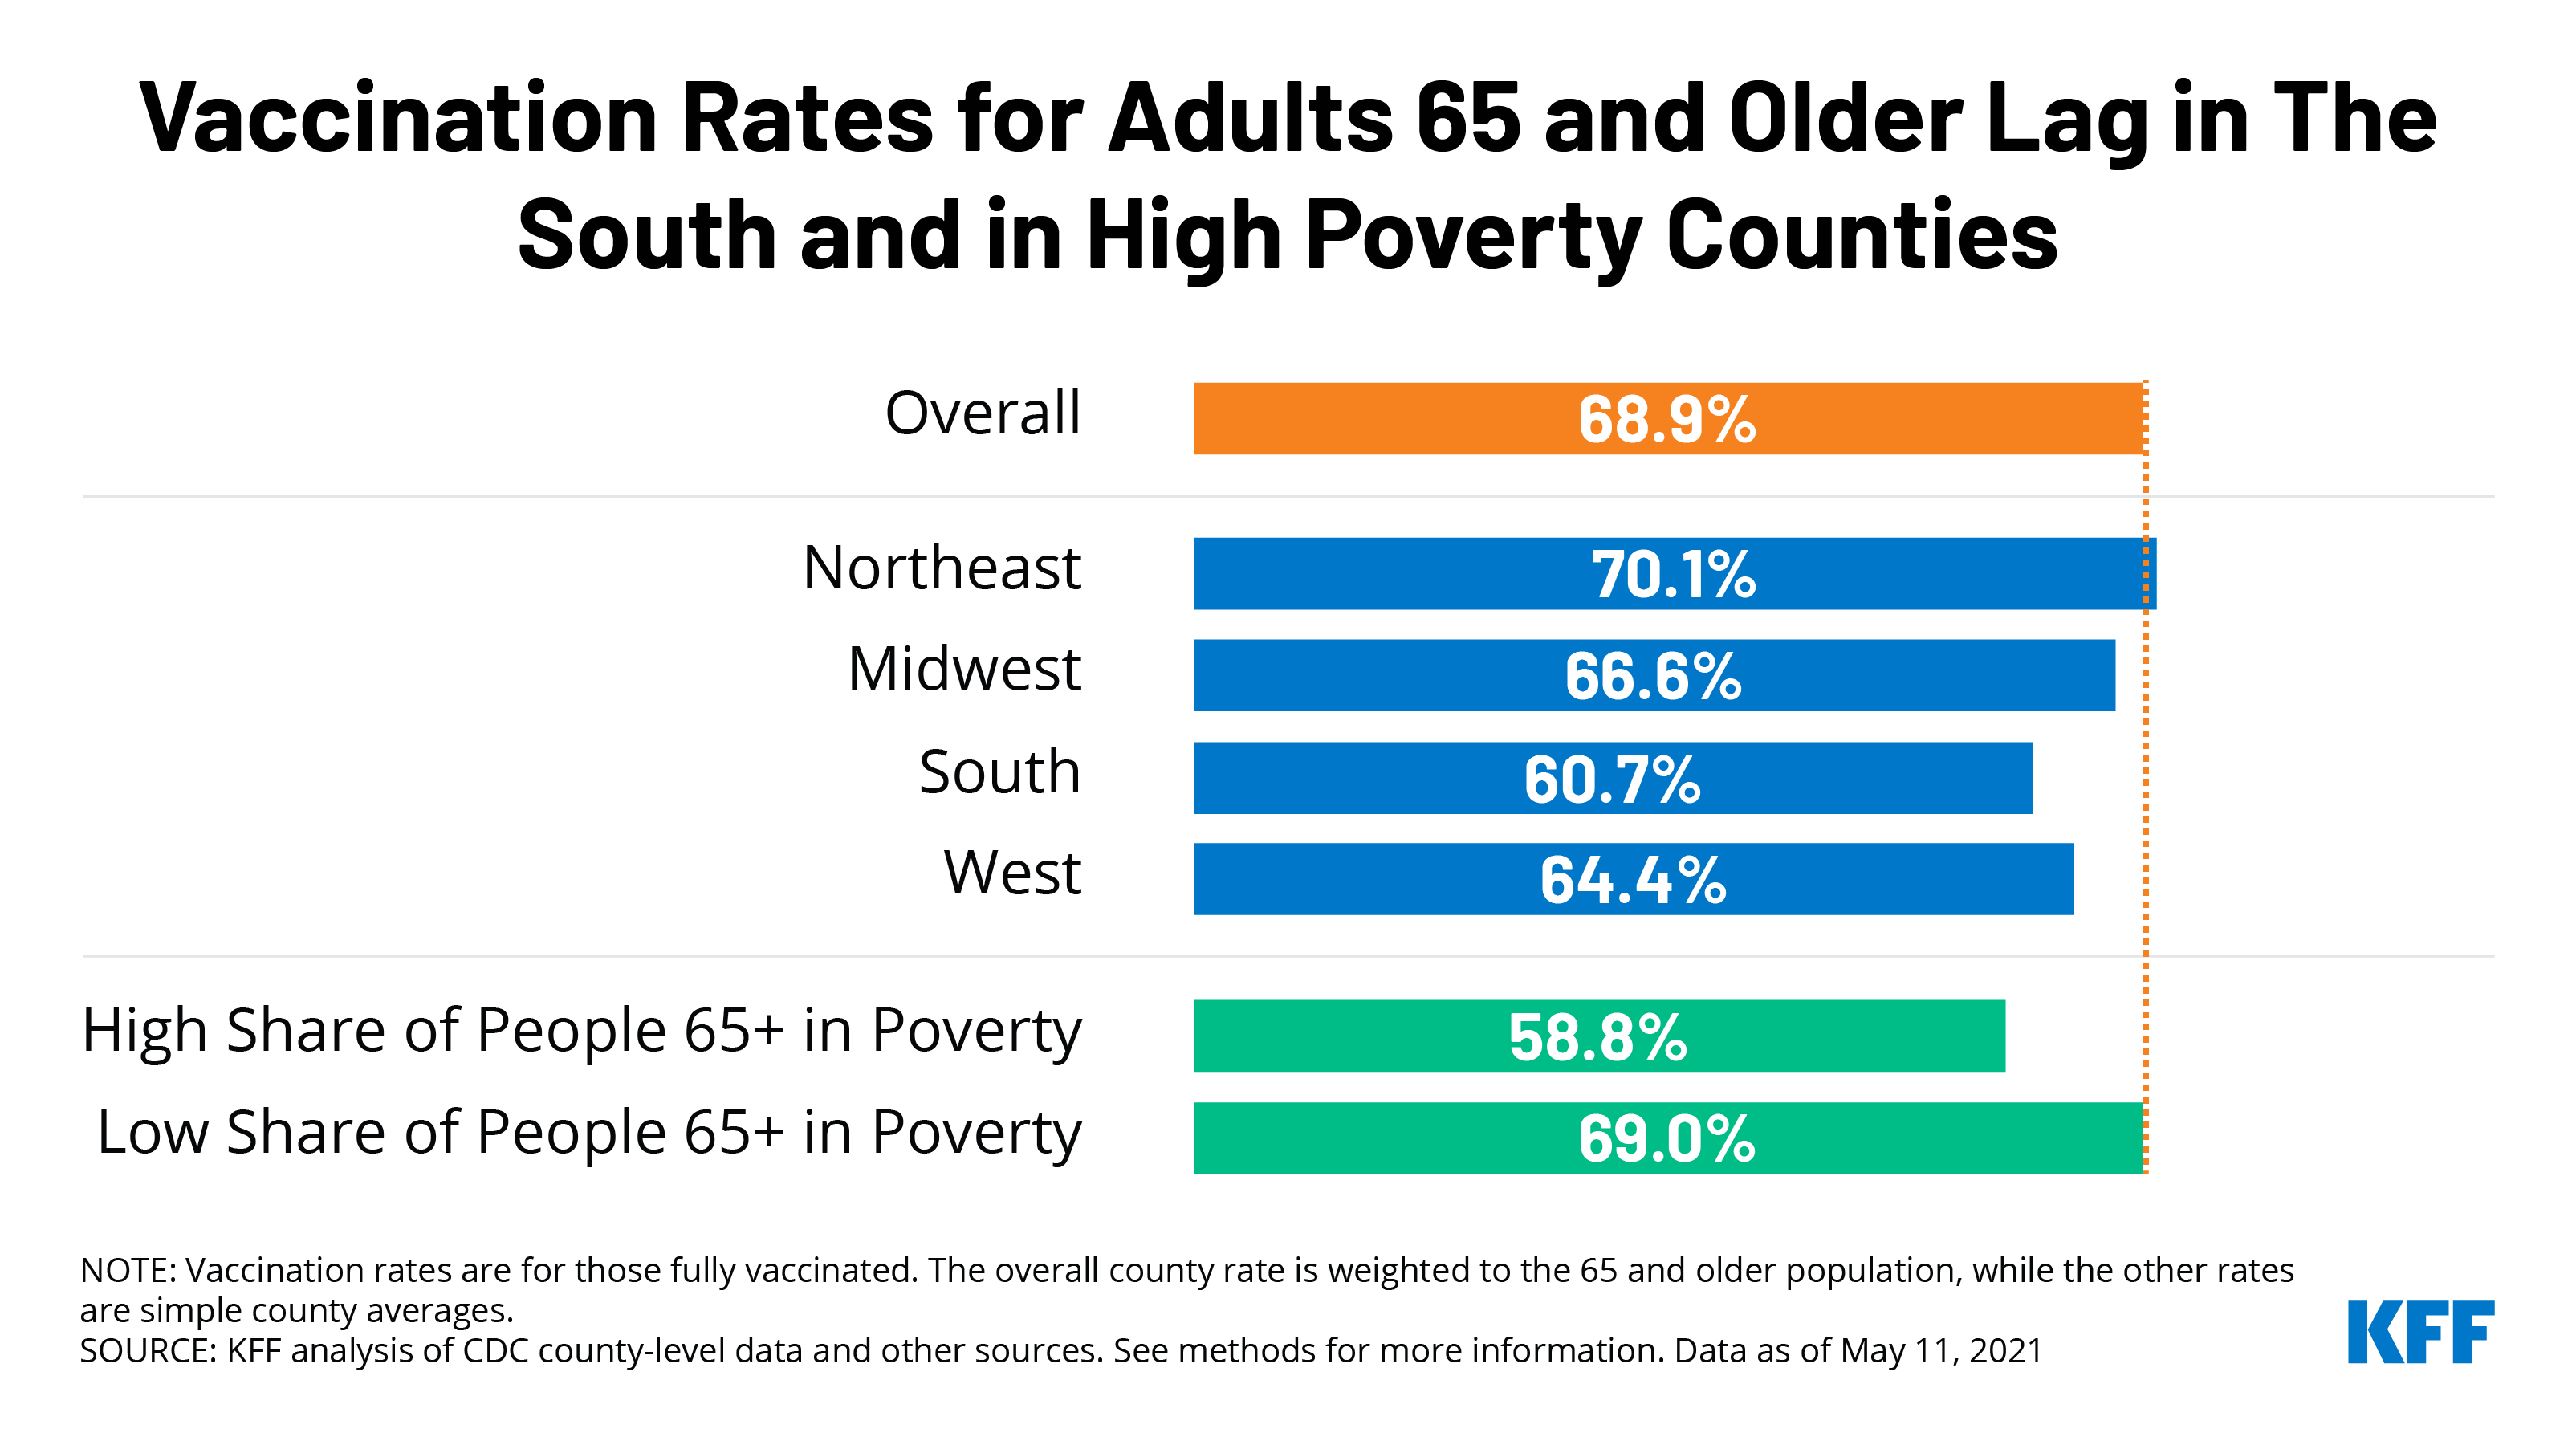
The average county COVID-19 vaccination rate weighted by population is 68.9% for adults ages 65 and older, but varies widely and is lower than average in counties:
- With a higher share of seniors living in poverty (58.8%)
- Ranking higher on the Social Vulnerability Index (60.1%)
- Located in the South (60.7%)
- With a higher share of adults who voted for Trump (63.3%) (Figure 1)
Findings
The average vaccination rate for adults 65 and older is 68.9% among counties reporting data, weighted by the population ages 65 and older (Figure 2).
Vaccination rates vary considerably across the 2,415 counties reporting data. At the high end (the top 10% of counties reporting data), at least 79.4% of adults 65 and older are fully vaccinated, and at the low end (the bottom 10% of counties), no more than 48.6% of older adults are fully vaccinated. However, rates are likely higher across all counties, including those in the top and bottom deciles, since vaccination rates continue to change rapidly.
Counties in the South have lower vaccination rates among older adults than counties in other regions, similar to findings from other KFF analysis that show vaccination rates overall are lower in Southern states (Figure 1; Table 1) The average vaccination rate for older adults in counties located in the South is 60.7%, lower than the average vaccination rate among older adults in counties in the Northeast (70.1%), Midwest (66.6%), and West (64.4%). Counties in the South represent a disproportionate share of counties with below-average vaccination rates: Southern counties comprise 34.0% of counties reporting data, but 42.9% of all counties with a vaccination rate below the weighted average of 68.9%. In contrast, Northeastern counties represent 8.4% of the overall counties reporting data, while only 5.4% of counties in this region have vaccination rates below the weighted average for older adults.
Vaccination rates among adults ages 65 and older are lower in counties where a relatively high share of adults 65 and older live in poverty compared to counties where a lower share of older adults live in poverty. Vaccination rates among adults 65 and older are more than 10 percentage points lower in counties where a higher share of people 65 and older live in poverty (58.8%) than in counties where a lower share of older adults live in poverty (69.0%).
Counties that rank high on the Social Vulnerability Index (SVI) show similar trends to counties with high shares of older adults living in poverty. This finding is not surprising given poverty is one of the 15 demographic measures used to calculate SVI, with other measures including race/ethnicity, disability, and lack of vehicle access. (SVI metrics are for the overall population of a county and are not just limited to adults 65 and older). Counties that rank high on the index (i.e., those with higher vulnerability) have a lower average vaccination rate for adults 65 and older than counties that rank lower on this index (60.1% vs 67.7%).
Consistent with the “wait and see” approach to vaccinations more common among Republican than Democratic voters, without regard to age, vaccination rates for older adults are lower in counties where a majority of voters voted for Donald Trump than in counties where a majority voted for Joe Biden in the 2020 election. In counties where Trump won the majority of votes, the average vaccination rate for adults 65 and older is more than 7 percentage points lower than in counties that voted for Biden (63.3% vs. 70.8%).
Discussion
While significant progress has been made in the last four months vaccinating older adults in the US against COVID-19, drilling down to the county level shows wide variation in the vaccination rate. These findings suggest there is more work to be done to increase vaccination rates for certain segments of the population, including older adults in Southern counties, in higher poverty areas, and in counties that voted for Trump. The fact that Southern counties lag in vaccinating older adults is consistent with higher poverty rates for older adults in the South than in other regions in the country. These results may also indicate that some older adults may face barriers that make it more difficult to access vaccinations, such as lack of transportation, lack of internet access, and health conditions that make traveling to vaccination sites difficult, among others. With 71.9% of older adults across all states in the US now fully vaccinated, this analysis nonetheless suggests that the push to vaccinate older adults is not yet over. Boosting vaccination rates among older adults – particularly among those living in high poverty areas and the South – may require additional and more targeted efforts to further remove barriers.
| This analysis draws on data from multiple sources. Our main outcome of interest, vaccination rates by county, was collected from the Centers for Disease Control and Prevention’s (CDC) COVID-19 Integrated County View. The CDC data reports completed vaccination rates for total population and population over age 65. Data are not reported for Hawaii, New Mexico, Texas, and the smallest counties in Alaska and California. In addition, we exclude data for counties where less than 80% of vaccination records include county of residence, which eliminated data for Colorado, Georgia, Vermont, Virginia, and West Virginia. The analysis includes data for 2,415 counties, 77% of total counties (3,142) in the US.
The average population-weighted county vaccination rate for the total population is slightly lower than national estimates due to missing data from several states and counties as noted above. We categorized states by region using the 2010 U.S. Census Bureau Region and Divisions classifications. Data to categorize counties by demographic characteristics of residents is pulled from the Census Bureau’s 2019 American Community Survey 5-Year Estimates by county. We use ACS data to categorize counties by residents’ poverty. Specifically, we calculate the share of the county population that is age 65 and over in a family with income below poverty. County Social Vulnerability Index (SVI) is from the CDC’s Agency for Toxic Substances and Disease Registry. SVI indicates a community’s vulnerability based on certain social conditions (i.e. socioeconomic status, household composition, language, etc.) that may affect the community in the event of a disaster. The 2020 Presidential Election results were pulled from a GitHub repository that compiled data from media sources including The Guardian, townhall.com, Fox News, Politico, and the New York Times. Alaska is excluded from this component of the analysis as the only data available is at the district-level and cannot be cross-walked onto counties. To classify counties, we translate continuous measures into categorical outcomes, using the group definitions below:
Given ongoing concerns related to equitable access to the COVID-19 vaccine, assessing differences in vaccination rates by race/ethnicity at the county level would add to existing national and state level data. However, the results of our analysis do not have face validity when compared to data analyzed at the individual level showing that people with Hispanic ethnicity are vaccinated at lower rates than White people, leading us to conclude that there are confounding factors driving the results based on county-level racial and ethnic composition. Therefore, we do not include comparisons of vaccination rates based on county racial and ethnic composition. |